Multiple Choice
Figure 3-F 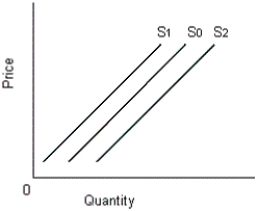
-Refer to Figure 3-F.A supply shift from S0 to S1 can be best explained by:
A) decrease in input prices.
B) price decreases for a substitute in production.
C) rise in taxes.
D) a technological advance.
Correct Answer:
Verified
Related Questions

