Multiple Choice
Exhibit 10-4 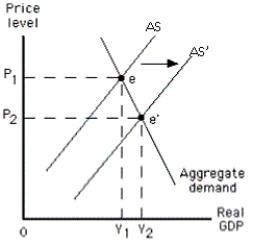
-The graph in Exhibit 10-4 shows a(n)
A) increase in short-run aggregate supply
B) increase in long-run aggregate supply
C) decrease in short-run aggregate supply
D) decrease in long-run aggregate supply
E) decrease in aggregate quantity demanded
Correct Answer:
Verified
Related Questions
Q109: Exhibit 10-5 Q110: Exhibit 10-5 Q111: If the expected price level exceeds the Q113: If the expected price level exceeds the Unlock this Answer For Free Now! View this answer and more for free by performing one of the following actions Scan the QR code to install the App and get 2 free unlocks Unlock quizzes for free by uploading documents![]()
![]()

