Exhibit 10-9 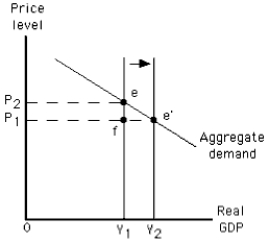
-The graph in Exhibit 10-9 shows a(n)
A) increase in short-run aggregate supply
B) increase in long-run aggregate supply
C) decrease in short-run aggregate supply
D) decrease in long-run aggregate supply
E) decrease in aggregate quantity demanded
Correct Answer:
Verified
Q159: Actual output falls below potential output
A)during a
Q160: Which of the following does not influence
Q161: Exhibit 10-9 Q162: During recessions,workers resist efforts to reduce nominal Q163: Which of the following would shift the Q165: An increase in the federal minimum wage Q166: Given the aggregate demand curve,a beneficial supply Q167: The potential level of output can be Q168: Which of the following is true of Q169: Floods in the midwest that diminish farm![]()
Unlock this Answer For Free Now!
View this answer and more for free by performing one of the following actions

Scan the QR code to install the App and get 2 free unlocks

Unlock quizzes for free by uploading documents