Multiple Choice
Exhibit 4-1 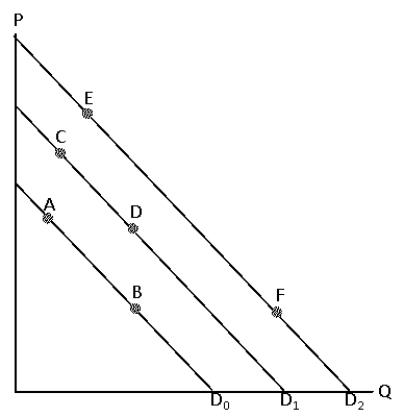
-Consider Exhibit 4-1 which shows 3 demand curves for corn flakes.Which of the following would be most likely to shift the demand curve from D0 to D1?
A) a report that eating corn flakes increases the risk of cancer
B) a decrease in consumer incomes if corn flakes is a normal good
C) a decrease in the price of oatmeal which many consumers consider to be a substitute for corn flakes
D) a decrease in the price milk which many consumers consider to be complement for corn flakes
E) a widely anticipated recession
Correct Answer:
Verified
Related Questions
Q26: Which of the following will not shift
Q32: The income effect of a decrease in
Q35: The income effect of an increase in

