Exhibit 4-1 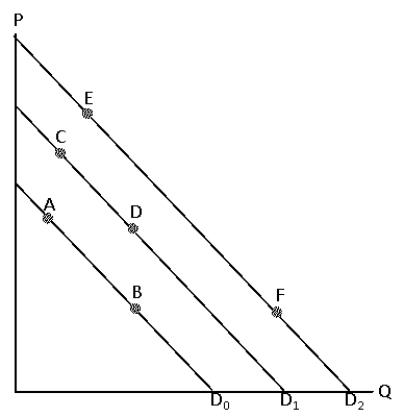
-Consider Exhibit 4-1 which shows 3 demand curves for corn flakes.Which of the following would be most likely to shift the demand curve from D2 to D1?
A) a report that eating corn flakes decrreases the risk of cancer
B) an increase in consumer incomes if corn flakes is a normal good
C) an increase in the price of oatmeal which many consumers consider to be a substitute for corn flakes
D) an increase in the price milk which many consumers consider to be complement for corn flakes
E) a widely anticipated recession
Correct Answer:
Verified
Q21: Exhibit 4-1 Q22: Exhibit 4-1 Q23: Exhibit 4-1 Q27: A demand curve usually has a Q28: Which of the following is not true Unlock this Answer For Free Now! View this answer and more for free by performing one of the following actions Scan the QR code to install the App and get 2 free unlocks Unlock quizzes for free by uploading documents![]()
![]()
![]()
A)negative slope

