Exhibit 2-10 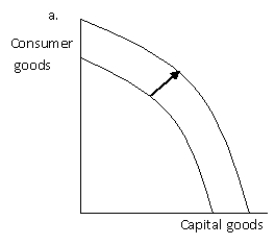
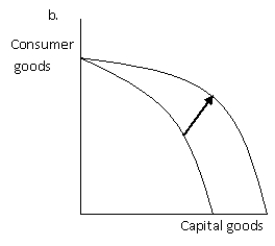
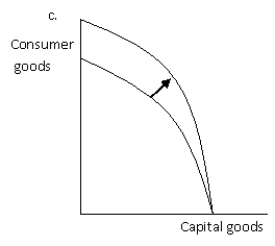
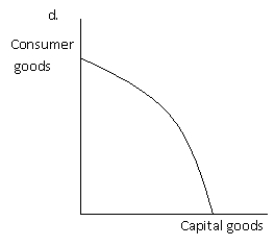
-Refer to Exhibit 2-10.Which of the graphs best illustrates the impact on the production possibilities frontier of a decrease in unemployment?
A) a
B) b
C) c
D) d
E) a,b and c
Correct Answer:
Verified
Q182: Exhibit 2-12 Maria and Hans Production Possibilities
Q183: Exhibit 2-12 Maria and Hans Production Possibilities
Q184: Exhibit 2-10 Q185: Exhibit 2-12 Maria and Hans Production Possibilities Q186: Exhibit 2-10 Q188: Exhibit 2-12 Maria and Hans Production Possibilities Q189: Exhibit 2-12 Maria and Hans Production Possibilities Unlock this Answer For Free Now! View this answer and more for free by performing one of the following actions Scan the QR code to install the App and get 2 free unlocks Unlock quizzes for free by uploading documents![]()
![]()

