Multiple Choice
Exhibit 1-16 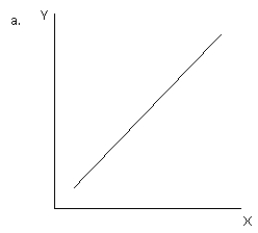
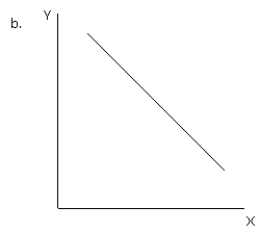
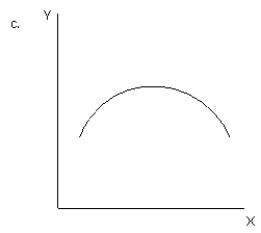
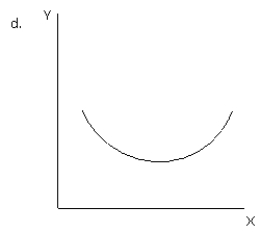
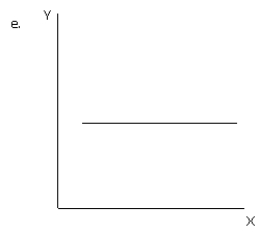
-Refer to Exhibit 1-16.Which graph illustrates a positive relationship between variable X and variable Y initially but then a negative relationship?
A) a
B) b
C) c
D) d
E) e
Correct Answer:
Verified
Related Questions
Q61: Most economics graphs reflect the relationship between
Q62: Exhibit 1-16 Q64: Exhibit 1-16 Q65: Exhibit 1-16 Q68: The part of a graph that is Q68: Exhibit 1-16 Q69: Exhibit 1-15 Q70: Exhibit 1-12 Q70: A tangent line is a straight line Q72: Exhibit 1-11 Unlock this Answer For Free Now! View this answer and more for free by performing one of the following actions Scan the QR code to install the App and get 2 free unlocks Unlock quizzes for free by uploading documents![]()
![]()
![]()
![]()
![]()
![]()
A)that![]()

