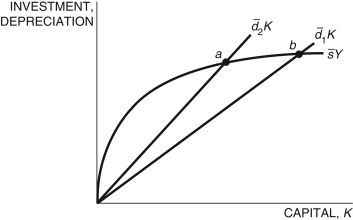
Refer to the following figure when answering
Figure 5.5: Solow Diagram 
-Consider Figure 5.5, which represents two countries, 1 and 2. Country ________ has a higher depreciation rate and, therefore, has a ________ steady state than the other country.
A) 1; higher
B) 1; lower
C) 2; higher
D) 2; lower
E) Not enough information is given.
Correct Answer:
Verified
Q84: In the Solow model, the equation
Q84: In the Solow model, it is assumed
Q85: On average, if both rich and poor
Q85: In the Solow model, if gross investment
Q86: Among the world as a whole, there
Q87: In the corn farm example, corn can
Q88: Among OECD countries, there is _ correlation
Q90: Refer to the following figure when answering
Q92: Figure 5.6 Q100: For which of the following does the![]()
Unlock this Answer For Free Now!
View this answer and more for free by performing one of the following actions

Scan the QR code to install the App and get 2 free unlocks

Unlock quizzes for free by uploading documents