Figure 6.1: Romer Model: Per Capita Output 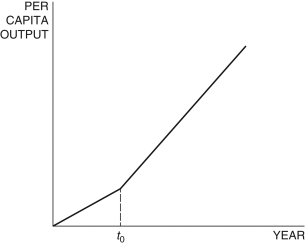
-In the Romer model in Figure 6.1, at time t0, a change in the growth rate of per capita output can be explained by:
A) a decrease in the ideas efficiency parameter
B) an increase in the population
C) an increase in the research share
D) an increase in the saving rate
E) a decrease in the population
Correct Answer:
Verified
Q37: In the Romer model, the more labor
Q38: What might be an explanation for the
Q39: In the Romer model, output is increasing
Q40: With monopolistic pricing, _ are needed to
Q41: Suppose the parameters of the Romer
Q43: In the Romer model, the Mexican economy:
A)
Q44: Suppose the parameters of the Romer
Q45: Suppose the Romer model parameters in
Q47: Suppose the parameters of the Romer
Q55: Because there are no diminishing returns in
Unlock this Answer For Free Now!
View this answer and more for free by performing one of the following actions

Scan the QR code to install the App and get 2 free unlocks

Unlock quizzes for free by uploading documents