Figure 6.2: Romer Model: Per Capita Output 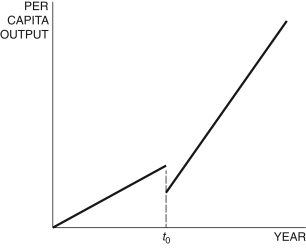
-In the Romer model in Figure 6.2, at time t0, a change in the shape of the production function can be explained by:
A) an increase in the population
B) an increase in the research share
C) an increase in the ideas efficiency parameter
D) an increase in the saving rate
E) an increase in the growth rate
Correct Answer:
Verified
Q51: Suppose the parameters of the Romer
Q52: The Romer model might be better explained
Q52: Nonrivalry in the knowledge sector means that:
A)
Q53: Suppose the parameters of the Romer
Q54: Nonrivalry in the Romer model means that
Q55: If Canada and Taiwan have the same
Q57: A balanced growth path is defined as
Q58: The parameter(s) in the Romer model is/are:
A)
Q60: Suppose the parameters of the Romer
Q61: In the growth accounting equation,
Unlock this Answer For Free Now!
View this answer and more for free by performing one of the following actions

Scan the QR code to install the App and get 2 free unlocks

Unlock quizzes for free by uploading documents