Refer to the following figure to answer
Figure 7.1: U.S. Unemployment Rate: 1975-2012 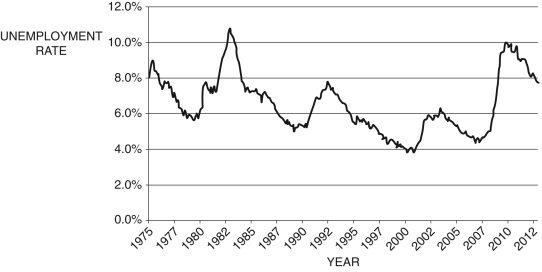 (Source: U.S. Bureau of Labor Statistics)
-Using Figure 7.1, which of the following year(s) are the trough of a recession?
A) 1980
B) 1989
C) 2001
D) 2010
E) All of these answers are correct.
Correct Answer:
Verified
Q1: Refer to the following figure to answer
Q3: The labor market determines:
A) the equilibrium wage
B)
Q5: Over the past 50 years or so:
A)
Q6: Over the past 50 years or so:
A)
Q7: Refer to the following table to
Q8: Refer to the following table to
Q9: Refer to the following table to
Q10: Refer to the following table to
Q14: If the U.S. real output is growing,
Q19: Over the course of his or her
Unlock this Answer For Free Now!
View this answer and more for free by performing one of the following actions

Scan the QR code to install the App and get 2 free unlocks

Unlock quizzes for free by uploading documents