Refer to the following figure to answer
Figure 7.1: U.S. Unemployment Rate: 1975-2012 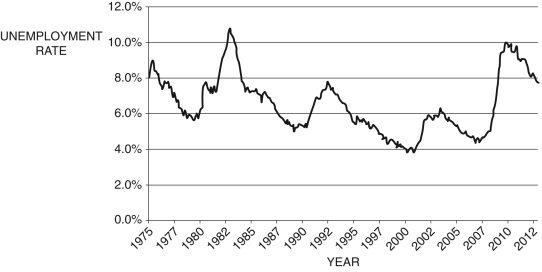 (Source: U.S. Bureau of Labor Statistics)
-Given the unemployment rate data depicted in Figure 7.1, identify the year of the peak of the boom:
A) 1993
B) 2001
C) 1983
D) 2010
E) 1992
Correct Answer:
Verified
Q3: Generally, during a recession:
A) inflation rises.
B) the
Q14: Refer to the following figure to answer
Q15: Refer to the following table to
Q16: Refer to the following figure to answer
Q17: Refer to the following table to
Q20: The quote "It's a recession when your
Q22: The labor demand curve slopes downward because:
A)
Q23: Refer to the following figure when
Q24: An increase in labor regulations results in:
A)
Q38: In the labor market, the intersection of
Unlock this Answer For Free Now!
View this answer and more for free by performing one of the following actions

Scan the QR code to install the App and get 2 free unlocks

Unlock quizzes for free by uploading documents