Refer to the following figure when answering
Figure 7.2: United Kingdom Unemployment Rate: 1971-2012 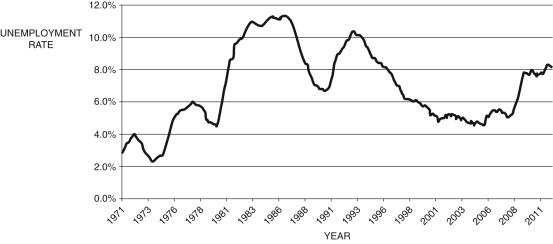
(Source: OECD and Federal Reserve Economic Data, Federal Reserve Bank of St. Louis)
-Given the unemployment rate data depicted in Figure 7.2, identify the year of the peak of the boom:
A) 1989
B) 1986
C) 1992
D) 2009
E) 1972
Correct Answer:
Verified
Q8: Refer to the following table to
Q9: Refer to the following table to
Q10: Refer to the following table to
Q12: Refer to the following figure when answering
Q14: Refer to the following figure to answer
Q15: Refer to the following table to
Q16: Refer to the following figure to answer
Q17: Refer to the following table to
Q19: Over the course of his or her
Q20: The quote "It's a recession when your
Unlock this Answer For Free Now!
View this answer and more for free by performing one of the following actions

Scan the QR code to install the App and get 2 free unlocks

Unlock quizzes for free by uploading documents