Figure 7.7: Unemployment Rate 1975-2012 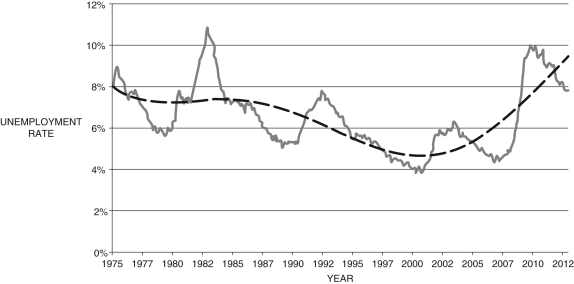 (Source: U.S. Bureau of Labor Statistics)
-Consider Figure 7.7, which shows the unemployment rate from 1975-2012.
(a) What does the dashed line represent? How can it be represented?
(b) Based solely on this data, was the period from approximately 1985-1991 an expansion or recession? Explain. What about the period 2007-2010?
(c) Based on the data presented, what is your prediction for future rates of unemployment?
Correct Answer:
Verified
View Answer
Unlock this answer now
Get Access to more Verified Answers free of charge
Q86: Unemployment due to institutional frictions is called
Q101: Historically, young French workers (under age 25)
Q102: In 2005, the wage premium for a
Q103: Consider the data in Table 7.3.
Unlock this Answer For Free Now!
View this answer and more for free by performing one of the following actions

Scan the QR code to install the App and get 2 free unlocks

Unlock quizzes for free by uploading documents