Figure 9.6: The Output Gap 1980-2012 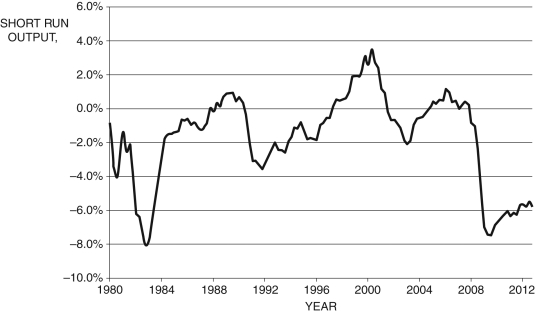 (SOURCE: Federal Reserve Economic Data, St. Louis Federal Reserve)
-Figure 9.6 above shows the output gap for the years 1980-2012. Using the Phillips curve and Okun's law, discuss the impacts on inflation and unemployment for the years 1997-2000 and 2008-2012. From this analysis, what is the relationship between unemployment and inflation?
Correct Answer:
Verified
View Answer
Unlock this answer now
Get Access to more Verified Answers free of charge
Q84: The Board of Governors of the Federal
Q96: Suppose an economy exhibits a large unexpected

Unlock this Answer For Free Now!
View this answer and more for free by performing one of the following actions

Scan the QR code to install the App and get 2 free unlocks

Unlock quizzes for free by uploading documents