Refer to the following figure when answering
Figure 12.10: Output Gap: 1990-2000 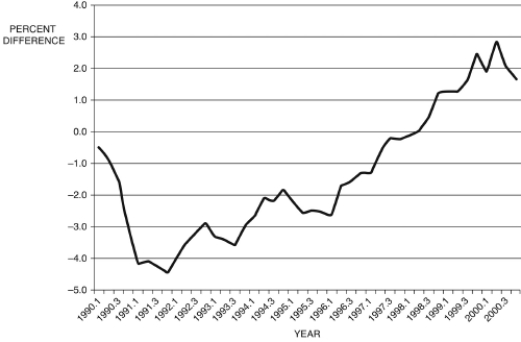
(Source: Federal Reserve Economic Data, St. Louis Federal Reserve)
-Consider Figure 12.10, which shows the output gap from 1990 to 2000, by quarter. If this is all the information you have, during the period 1997.1-1999.4, from the Phillips curve, you would conclude that:
A) inflation is accelerating,
B) inflation is decelerating,
C) unemployment is falling
D) unemployment is rising
E) Not enough information is given.
Correct Answer:
Verified
Q61: Figure 12.8: Output Q68: One of the remarkable things about the Q70: Which of the following statements is NOT Q71: As lender in the last resort, the Q72: Refer to the following figure when Q74: Refer to the following figure when Q77: The nominal interest rate: Q80: Refer to the following figure when Q86: Which of the following innovations have become Q87: When a central bank targets the money![]()
A) is set by
Unlock this Answer For Free Now!
View this answer and more for free by performing one of the following actions

Scan the QR code to install the App and get 2 free unlocks

Unlock quizzes for free by uploading documents