Figure 12.17: Real GDP and Non-Farm Employment (1999.07 = 100) 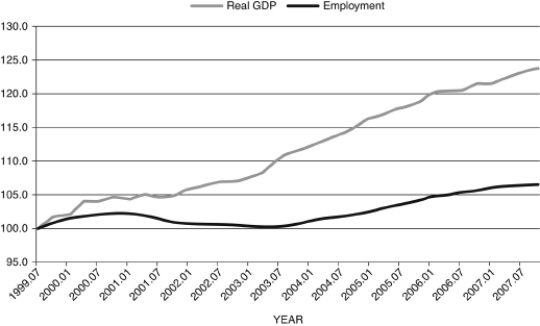
(Source: Federal Reserve Economic Data, St. Louis Federal Reserve)
-Figure 12.17 shows quarterly real GDP and non-farm employment from 1999.07-2007.07. Discuss what is notable about this relationship.
Correct Answer:
Verified
View Answer
Unlock this answer now
Get Access to more Verified Answers free of charge
Q110: Usually the yield curve slopes downward.
Q122: Figure 12.16: Output Q123: Figure 12.13 shows the yield curve for Q123: The interest rate that the Fed charges Q127: Discuss the differences between the ex ante Q128: What tool does the U.S. Federal Reserve Q129: What are the mechanics of lowering interest Q129: You've been asked to spend a week Q133: The open-market operations desk is at the Q135: Refer to the following figure when answering![]()
Unlock this Answer For Free Now!
View this answer and more for free by performing one of the following actions

Scan the QR code to install the App and get 2 free unlocks

Unlock quizzes for free by uploading documents