The following figure shows the BAA corporate and 10-Year Treasury Bond yields. Refer to this figure when answering
Figure 14.1: BAA and 10-Year Bonds, 2006-2010 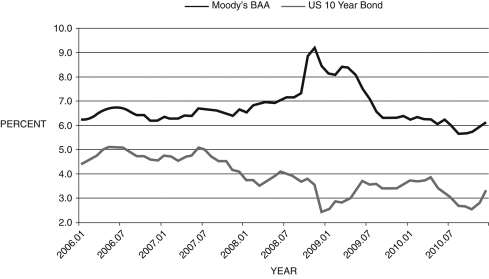
(Source: Federal Reserve Economic Data, St. Louis Federal Reserve)
-Consider Figure 14.1 above. The difference between these two curves can be interpreted as:
A) the financial friction
B) inflation expectations
C) the risk-free rate
D) a market imperfection
E) the prime lending rate
Correct Answer:
Verified
Q7: Refer to the following figure when answering
Q8: Which of the following represents the
Q11: The financial friction is the:
A) difference between
Unlock this Answer For Free Now!
View this answer and more for free by performing one of the following actions

Scan the QR code to install the App and get 2 free unlocks

Unlock quizzes for free by uploading documents