The following figure shows the inflation rate and ten-year bond yield. Refer to this figure when answering
Figure 14.4: Inflation and 10-Year Bond Yields 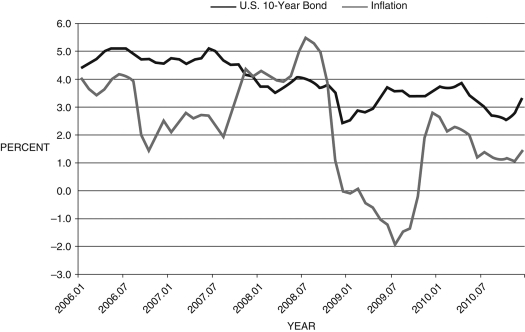
-Consider Figure 14.4 above. For most of 2008 the:
A) real interest rate was negative
B) 10-year-bonds' nominal interest rate was less than the real interest rate
C) real interest rate was zero
D) real interest rate was positive
E) None of these answers are correct.
Correct Answer:
Verified
Q21: When there is deflation:
A) the central bank
Q22: The effect of the subprime loan crisis
Q23: The liquidity trap occurs when:
A) real interest
Q25: The effects of deflation mimic the analysis
Q31: Refer to the following figure when answering
Q32: The following figure shows the inflation rate
Q33: In the AS/AD framework, the financial friction
Q34: Refer to the following figure when answering
Q38: According to the Fisher equation, the
Q55: Prior to the recent financial crisis, the
Unlock this Answer For Free Now!
View this answer and more for free by performing one of the following actions

Scan the QR code to install the App and get 2 free unlocks

Unlock quizzes for free by uploading documents