Refer to the following figure when answering the following questions.
Figure 16.4: Personal Saving Rate: 1990-2010 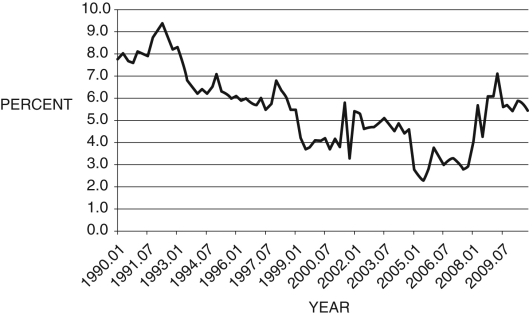
-Consider Figure 16.4. A possible cause for the fall in the saving rate between 1990 and 2005 is:
A) precautionary saving.
B) consumption smoothing.
C) the changing composition of households' savings portfolios.
D) increasing competition among commercial banks.
E) less access to credit markets.
Correct Answer:
Verified
Q74: Precautionary savings lead households to act as
Q75: Between 1970 and 2008, household consumption _
Q76: If an individual has no access to
Q77: Individuals who have restricted access to credit
Q78: One of the findings of studies in
Q80: Refer to the following figure when answering
Q81: The utility function is constructed in such
Q82: If we lower taxes today but raise
Q83: Figure 16.6: Personal Savings Rate 
Q84: Because people cannot perfectly foresee income changes
Unlock this Answer For Free Now!
View this answer and more for free by performing one of the following actions

Scan the QR code to install the App and get 2 free unlocks

Unlock quizzes for free by uploading documents