Figure 16.5: Personal Savings Rate 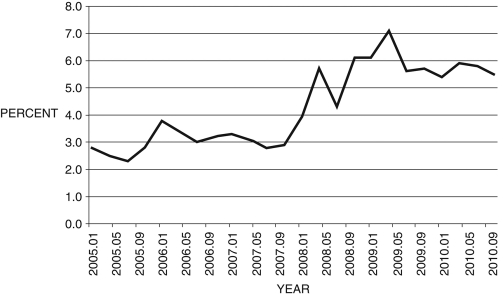 (Source: Federal Reserve Economic Data, St. Louis Federal Reserve)
-Consider Figure 16.5. A likely explanation for the rise in savings rates beginning in 2007 is the continued strength in stock and housing markets.
Correct Answer:
Verified
Q83: Figure 16.6: Personal Savings Rate 
Q86: Consider consumption in two periods,
Q88: A widely used utility function in
Q89: In the intertemporal budget
Q90: In the intertemporal budget constraint, wealth is
Q91: We can treat all households as homogeneous.
Q92: Individuals who have restricted access to credit
Q93: Behavioral economics treats all households as heterogeneous.
Q94: Consumption smoothing is an implication of the
Q95: If we lower taxes today but
Unlock this Answer For Free Now!
View this answer and more for free by performing one of the following actions

Scan the QR code to install the App and get 2 free unlocks

Unlock quizzes for free by uploading documents