Consider Figure 16.6, which shows the federal funds rate and household consumption. For your answer use a logarithmic utility function.
a. What is the relationship between consumption growth and the interest rate according to the Euler equation?
b. Does the data in the figure support or reject this relationship for the entire period? Explain.
c. What might help explain consumption behavior, particularly in 2008-2009?
Figure 16.6: Federal Funds Rate and Household Consumption: 2002-2012 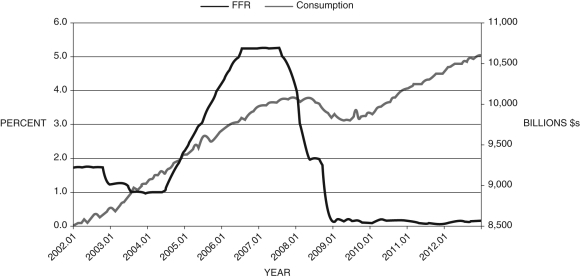
(Source: Federal Reserve Economic Data, St. Louis Federal Reserve)
Correct Answer:
Verified
View Answer
Unlock this answer now
Get Access to more Verified Answers free of charge
Q84: Because people cannot perfectly foresee income changes
Q91: We can treat all households as homogeneous.
Q95: If we lower taxes today but
Q97: The left-hand side of the Euler
Q99: When applied to the first President Bush's
Q100: For any two periods, t and
Q101: Figure 16.7: Personal Savings Rates 
Q103: You are currently an economics major
Q108: In 1992, the first Bush administration was
Q109: Are all households homogeneous and rational, at
Unlock this Answer For Free Now!
View this answer and more for free by performing one of the following actions

Scan the QR code to install the App and get 2 free unlocks

Unlock quizzes for free by uploading documents