Figure 17.7: Price-Earnings Ratio: 1985-2012 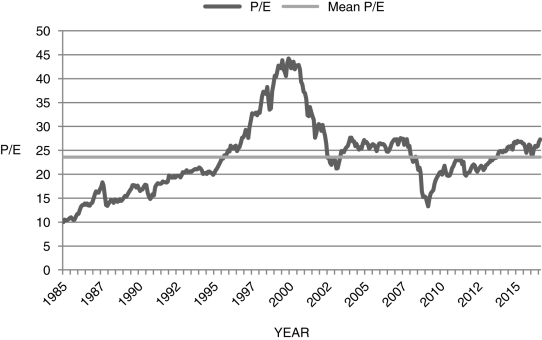
-Your parents were pretty enthusiastic about the gains they made in the stock market in the late 1990s. They were not as enthusiastic when it collapsed in 2001, as they expected these gains to last forever. They show you the graph above, which shows the price-earnings ratio from 1985-2012. Explain to them what happened and why it would not have lasted forever.
Correct Answer:
Verified
View Answer
Unlock this answer now
Get Access to more Verified Answers free of charge
Q106: If the real interest rate is more
Q107: Over the 10-year period from 1997-2005, real
Q108: From the residential arbitrage equation, a rise
Q109: Briefly discuss the different types of investment.
Q110: When Tobin's q is equal to zero,
Q111: If a stock is just as likely
Q112: Nonresidential fixed investment, residential fixed investment, and
Q113: Over the long run, the average P/E
Q114: Tobin's q is the ratio of stock
Q116: Figure 17.8: Weekly Percent Change in Apple
Unlock this Answer For Free Now!
View this answer and more for free by performing one of the following actions

Scan the QR code to install the App and get 2 free unlocks

Unlock quizzes for free by uploading documents