Consider the following Phillips curve diagram:
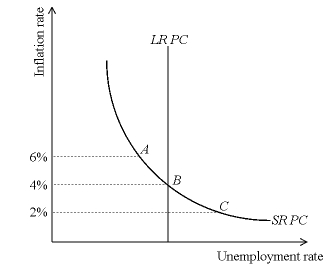 For the case where the economy is at Point A,Point B,or Point C,explain:
(a)whether actual inflation is above or below expected inflation (What is each exactly?)
(b)the likely shift in the short-run Phillips curve
(c)the likely change in unemployment
Correct Answer:
Verified
(a) Actu...
View Answer
Unlock this answer now
Get Access to more Verified Answers free of charge
Q37: Explain how the institutional theory of inflation
Q38: Why do some central banks issue large
Q42: Explain how the quantity theorists view the
Q164: Suppose the money supply is $100 billion
Q165: Use a Phillips curve diagram to explain
Q166: Draw a short run and long-run Phillips
Q167: Define the short-run Phillips curve.
Q168: Using the AD/AS and the Phillips curve
Q169: Assume the money supply is $1000,the velocity
Q180: Distinguish between demand-pull and cost-push inflation.
Unlock this Answer For Free Now!
View this answer and more for free by performing one of the following actions

Scan the QR code to install the App and get 2 free unlocks

Unlock quizzes for free by uploading documents