Consider the following multiplier model diagram:
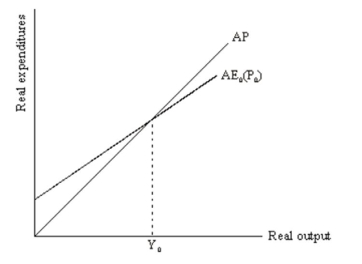 Demonstrate graphically (and explain your graph)what will happen in the picture when the price level increases.Link this diagram to the AD/AS model by showing the effects of an increase in the price level in the AD/AS model.Assume a horizontal SAS curve.
Correct Answer:
Verified
View Answer
Unlock this answer now
Get Access to more Verified Answers free of charge
Q27: Consider the following multiplier model diagram:
Q28: Consider the following multiplier model diagram:
Q29: Consider a multiplier model in which autonomous
Q30: Consider the following multiplier model:
AE = 5,000
Q31: Consider the following multiplier model diagram:
Q33: (a)Draw an aggregate production curve and explain
Q34: Answer parts (a)-(e)below on the basis
Q35: Suppose the multiplier model is
C = C0
Q36: Consider the following multiplier model:
AE = 8,000
Q37: For each of the following state
Unlock this Answer For Free Now!
View this answer and more for free by performing one of the following actions

Scan the QR code to install the App and get 2 free unlocks

Unlock quizzes for free by uploading documents