Consider the following multiplier model diagram:
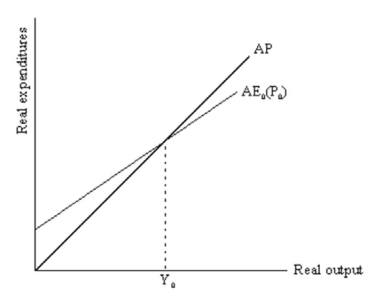 Demonstrate graphically (and explain your graph)what will happen in the picture when autonomous spending increases.Demonstrate the same in the AD/AS model.
Correct Answer:
Verified
View Answer
Unlock this answer now
Get Access to more Verified Answers free of charge
Q19: What is the real business cycle theory
Q20: What is the marginal propensity to expend?
Q21: Suppose the multiplier model is
C = C0
Q22: Answer parts (a)-(e)below based on the AE
Q23: (a)Demonstrate graphically and explain the implications of
Q25: Consider the following multiplier model diagram:
Q26: The mpe for the economy is 0.67.Autonomous
Q27: Consider the following multiplier model diagram:
Q28: Consider the following multiplier model diagram:
Q29: Consider a multiplier model in which autonomous
Unlock this Answer For Free Now!
View this answer and more for free by performing one of the following actions

Scan the QR code to install the App and get 2 free unlocks

Unlock quizzes for free by uploading documents