The graph below shows the supply and demand curves for dollars in the pound/dollar market. 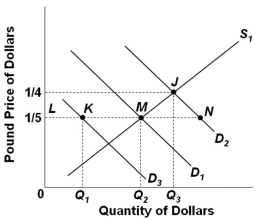 Refer to the graph above. Assume that D1 and S1 are the initial demand for and supply of dollars. Suppose that Britain's demand for dollars increases from D1 to D2. If the British government wishes to fix the exchange rate at the initial level, then it would be faced with a problem of:
A) Deteriorating terms of trade
B) Rationing LM dollars among British importers who would like to acquire LN dollars
C) A rise in the pound price of dollars
D) Rationing LN dollars among British importers who would like to acquire LM dollars
Correct Answer:
Verified
Q81: Q82: Assume that Japan and the United States Q83: The graph below shows the supply and Q84: According to the purchasing power parity theory, Q85: Which of the following would tend to Q87: Assume that U.S. and European governments adopt Q88: The graph below shows the supply and Q89: Which is not a serious disadvantage associated Q90: Assume that Japan and the United States Q91: With flexible exchange rates, an increase in![]()
Unlock this Answer For Free Now!
View this answer and more for free by performing one of the following actions

Scan the QR code to install the App and get 2 free unlocks

Unlock quizzes for free by uploading documents