Multiple Choice
 Refer to the graph above. A movement from point C to point D on the Laffer Curve represents:
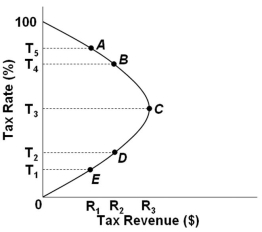
A) Increased tax rates from T2 to T3 and increased tax revenues from R2 to R3
B) Decreased tax rates from T3 to T2 and increased tax revenues from R2 to R3
C) Decreased tax rates from T3 to T2 and decreased tax revenues from R3 to R2
D) Increased tax rates from T2 to T3 and decreased tax revenues from R3 to R2
Correct Answer:
Verified
Related Questions
Unlock this Answer For Free Now!
View this answer and more for free by performing one of the following actions

Scan the QR code to install the App and get 2 free unlocks

Unlock quizzes for free by uploading documents