Multiple Choice
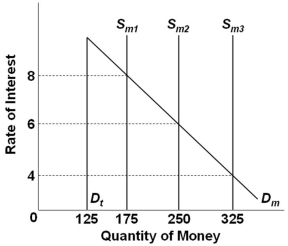 Refer to the graph above, in which Dt is the transactions demand for money, Dm is the total demand for money, and Sm is the supply of money. The market is initially in equilibrium at a 6 percent rate of interest. If the supply of money increases as shown, then the asset demand for money will increase by:
A) $75
B) $125
C) $200
D) $325
Correct Answer:
Verified
Related Questions

