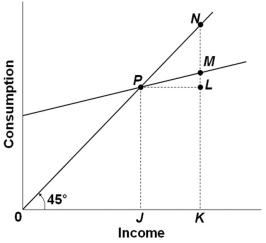
 The graph above shows the relationship between consumption and income. Which of the following statements is correct?
A) The marginal propensity to consume in the economy shown is greater than 1
B) The marginal propensity to consume varies across income levels
C) The average propensity to consume at income level K is given by KM divided by KN
D) The marginal propensity to consume can be calculated by dividing LM by 0K
Correct Answer:
Verified
Q41: When the marginal propensity to consume is
Q42: The table shows a consumption schedule.
Q43: The table shows a consumption schedule.
Q44: Q45: The table shows a consumption schedule. Q47: Q48: Which of the following would shift the Q49: The disposable income (DI) and consumption (C) Q50: Q51: Unlock this Answer For Free Now! View this answer and more for free by performing one of the following actions Scan the QR code to install the App and get 2 free unlocks Unlock quizzes for free by uploading documents![]()
![]()
![]()
![]()

