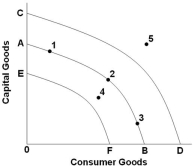
 Refer to the above diagram. Which of the following is the most likely cause for a shift in the production possibilities curve from AB to CD?
A) The use of the economy's resources in a more efficient way
B) An increase in the spending of business and consumers
C) An increase in government purchase of the economy's output
D) An increase in the quantity and quality of labor resources
Correct Answer:
Verified
Q34: The number of worker-hours available in an
Q35: Q36: Society can increase its output and income Q38: Economic growth can best be portrayed as Q40: Supply factors in economic growth include the Q41: The factor accounting for the largest increase Q42: Trends in educational attainment in the U.S. Q43: In 2011, what percent of adults in Q44: One concern regarding educational attainment in the Q173: Assume that an economy has 1,500 workers,![]()
Unlock this Answer For Free Now!
View this answer and more for free by performing one of the following actions

Scan the QR code to install the App and get 2 free unlocks

Unlock quizzes for free by uploading documents