The table below shows the quantity of labor (measured in hours) and the productivity of labor (measured in real GDP per hour) in a hypothetical economy in three different years. 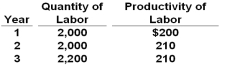 Refer to the above table. In Year 2, the economy's real GDP was:
A) $400,000
B) $420,000
C) $462,000
D) $500,000
Correct Answer:
Verified
Q42: Trends in educational attainment in the U.S.
Q43: In 2011, what percent of adults in
Q44: One concern regarding educational attainment in the
Q45: The shift of labor out of agriculture
Q46: The size of the labor force depends
Q48: Which of the following factors has been
Q49: What economic concept would be most closely
Q50: Which of the following factors is projected
Q51: In the U.S. economic-growth experience:
A) Most capital
Q52: Technological advances that contribute to economic growth
Unlock this Answer For Free Now!
View this answer and more for free by performing one of the following actions

Scan the QR code to install the App and get 2 free unlocks

Unlock quizzes for free by uploading documents