The table below shows the quantity of labor (measured in hours) and the productivity of labor (measured in real GDP per hour) in a hypothetical economy in three different years. 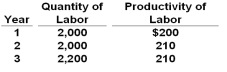 Refer to the above table. Between Year 2 and Year 3, real GDP increased by:
A) 2 percent
B) 5 percent
C) 10 percent
D) 15 percent
Correct Answer:
Verified
Q52: Technological advances that contribute to economic growth
Q53: The movement of workers from lower productivity
Q54: Technological advance is very tightly intertwined with:
A)
Q55: In the U.S. in the past six
Q56: Historically, the total amount of real capital
Q58: Labor productivity can only increase if:
A) Labor
Q59: Human capital refers to the:
A) Tools and
Q60: Which of the following is the single
Q61: Sources of increasing returns that help raise
Q185: Increasing returns would be a situation where
Unlock this Answer For Free Now!
View this answer and more for free by performing one of the following actions

Scan the QR code to install the App and get 2 free unlocks

Unlock quizzes for free by uploading documents