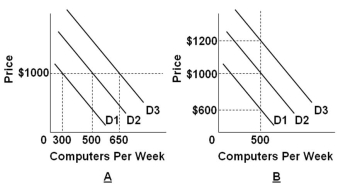
 Refer to the graphs above. Which of the following best represents a positive demand shock when prices are flexible?
A) The shift from D2 to D3 in graph B
B) The shift from D2 to D3 in graph A
C) The shift from D2 to D1 in graph B
D) The shift from D2 to D1 in graph A
Correct Answer:
Verified
Q65: Q66: If prices of goods and services are Q67: If prices are "sticky" in the short Q68: Inventories held by firms: Q69: Business cycle fluctuations typically arise because: Q71: Because prices are sticky, positive demand shock Q72: If prices of goods and services quickly Q73: If prices of goods and services are Q74: Q75: Unlock this Answer For Free Now! View this answer and more for free by performing one of the following actions Scan the QR code to install the App and get 2 free unlocks Unlock quizzes for free by uploading documents![]()
A) Tend to increase
A) The![]()
![]()

