In the diagrams below, the subscript "1" refers to the initial position of the curve, while the subscript "2" refers to the final position after the curve shifts. 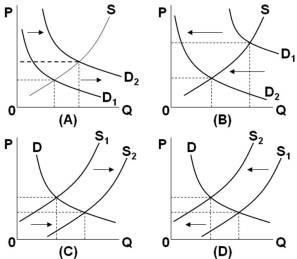 Which diagram above illustrates the effects on the peanut butter market, if severe flooding destroys a large portion of the peanut crop in the economy?
A) A
B) B
C) C
D) D
Correct Answer:
Verified
Q107: In the diagrams below, the subscript "1"
Q108: An increase in the demand for corn
Q109: Over a period of time, the equilibrium
Q110: Assume that the graphs show a competitive
Q111: A decrease in demand and an increase
Q113: What combination of changes would most likely
Q114: The following data show the supply and
Unlock this Answer For Free Now!
View this answer and more for free by performing one of the following actions

Scan the QR code to install the App and get 2 free unlocks

Unlock quizzes for free by uploading documents