Multiple Choice
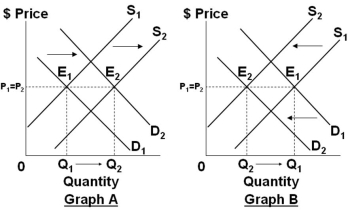
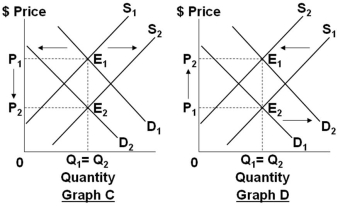 Refer to the four graphs above. Select the graph above that best shows the changes in demand and supply in the market specified in the following situation: In the market for corn, if gasoline producers use more ethanol from corn, and good weather during the growing season yields a bumper harvest.
A) Graph A
B) Graph B
C) Graph C
D) Graph D
Correct Answer:
Verified
Related Questions
Q121: A government-set price floor on a product:
A)

