Multiple Choice
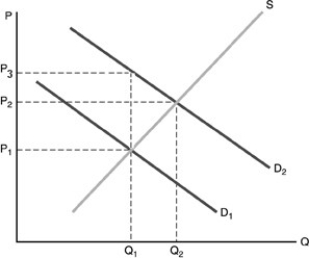
-Refer to the above figure. The market equilibrium quantity is Q1. Point Q2 represents the optimal amount of production. This indicates that there is
A) a public good which should be produced.
B) regressive taxation of the product.
C) a positive externality.
D) a negative externality.
Correct Answer:
Verified
Related Questions
Q112: When there is an external benefit, the
Q113: Q114: Positive externalities arise when Q115: An externality is![]()
A) an unprofitable firm
A) a third-party benefit or
Unlock this Answer For Free Now!
View this answer and more for free by performing one of the following actions

Scan the QR code to install the App and get 2 free unlocks

Unlock quizzes for free by uploading documents