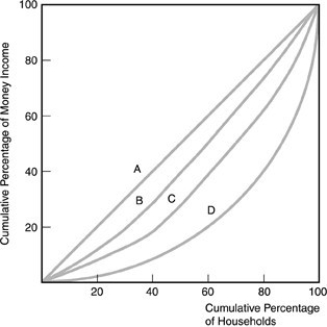
-Refer to the above figure. Where are the poorest households represented on the graph?
A) The poorest households are to the left along the horizontal axis.
B) The poorest households are to the right along the horizontal axis.
C) The poorest households are all along the horizontal axis.
D) The poorest households are concentrated in the middle.
Correct Answer:
Verified
Q20: The distribution of income in one nation
Q21: The way income is allocated among the
Q22: If everyone earned the same income, the
Q23: Some economists criticize the Lorenz curve because
Q24: A Lorenz curve that represents an unequal
Unlock this Answer For Free Now!
View this answer and more for free by performing one of the following actions

Scan the QR code to install the App and get 2 free unlocks

Unlock quizzes for free by uploading documents