Multiple Choice
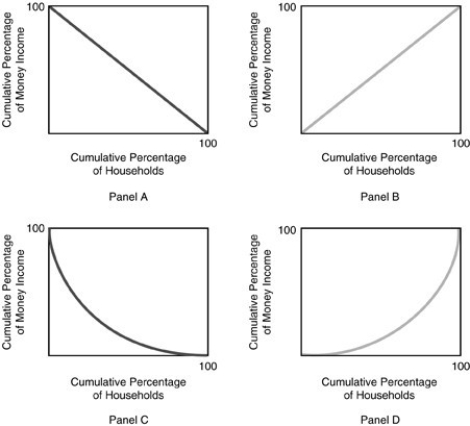
-Refer to the above figure. Which of the above graphs represents an unequal income distribution?
A) Panel A
B) Panel B
C) Panel C
D) Panel D
Correct Answer:
Verified
Related Questions
Q49: Which of the following is NOT a
Q50: The return on wealth is
A) a stock
Q51: When comparing the distribution of wealth to

