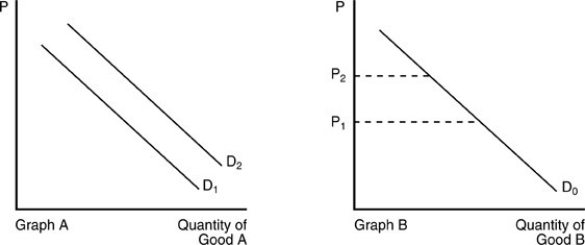
-In the above figure, the demand curve for Good A shifts from D1 to D2 in Graph A when the price of Good B changes from P1 to P2 in Graph B. We can conclude that
A) Good A and Good B are substitutes.
B) Good A and Good B are complements.
C) Good A is a normal good but Good B is an inferior good.
D) Good A and Good B are unrelated.
Correct Answer:
Verified
Q140: If bagels and croissants are substitute goods,
Q141: If two goods, J and K, are
Q142: An increase in the price of wheat
Q143: Which of the following pairs of goods
Q144: Two goods are substitutes when
A) an increase
Q146: If the price of apples goes down,
Q147: When the price of tablet devices decreased
Q148: After the price of smartphone apps falls,
Q149: There is an increase in the demand
Q150: ![]()
Unlock this Answer For Free Now!
View this answer and more for free by performing one of the following actions

Scan the QR code to install the App and get 2 free unlocks

Unlock quizzes for free by uploading documents