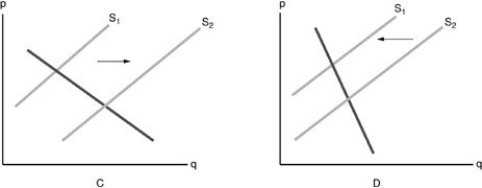
-Refer to the above figure. Plastic is an input for producing cellphones. Which diagram shows the effect on the supply of cellphones when the price of plastic has increased?
A) graph C
B) graph D
C) neither graph
D) both graphs
Correct Answer:
Verified
Q319: Q320: The effects of a per-unit tax imposed Q321: When the price of a good rises, Q322: The imposition of a per unit tax Q323: Which of the following is a likely Q325: Q326: Which of the following will NOT cause Q327: Which of the following will NOT cause Q328: Which of the following will shift the Q329: Unlock this Answer For Free Now! View this answer and more for free by performing one of the following actions Scan the QR code to install the App and get 2 free unlocks Unlock quizzes for free by uploading documents![]()
![]()
![]()

