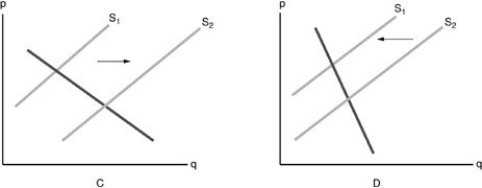
-Refer to the above figure. Which diagram shows the effect on the market of cellphones when the price of plastic has increased?
A) graph C
B) graph D
C) neither graph
D) both graphs
Correct Answer:
Verified
Q342: Which of the following will NOT affect
Q343: Q344: When the amount supplied is greater at Q345: In order to increase the supply of Q346: According to the above figure for a Q348: If there is a decline in the Q349: Briefly discuss the determinants of supply other Q350: How is the market supply curve found? Q351: The market supply curve is found by Q352: ![]()
A)![]()
Unlock this Answer For Free Now!
View this answer and more for free by performing one of the following actions

Scan the QR code to install the App and get 2 free unlocks

Unlock quizzes for free by uploading documents