Multiple Choice
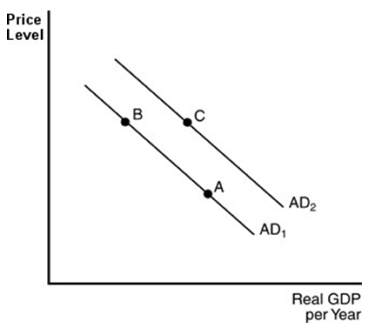
-In the above figure, a movement from point B to point C could be explained by
A) an increase in the price level.
B) a decrease in the quantity of money in circulation.
C) increased government spending.
D) the real-balance effect.
Correct Answer:
Verified
Related Questions
Q205: "The aggregate demand curve slopes down for
Q206: Which of the following will NOT shift
Q207: What information is provided by the aggregate
Q208: What is the aggregate demand curve and
Q209: An increase in the amount of money
Q211: Which of the following will NOT shift
Unlock this Answer For Free Now!
View this answer and more for free by performing one of the following actions

Scan the QR code to install the App and get 2 free unlocks

Unlock quizzes for free by uploading documents