For eight randomly selected states,the following table lists the per capita beer consumption (in gallons) and the per capita wine consumption (in gallons) 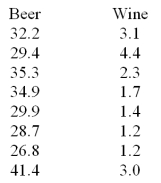 Calculate the rank correlation coefficient when beer consumption = x and wine consumption = y
A) rs = .506
B) rs = .703
C) rs = .711
D) rs = .494
Correct Answer:
Verified
Q76: The EPA has stipulated that the
Q77: Five years ago,the average starting salary
Q78: The EPA has stipulated that the
Q79: Five years ago,the average starting salary
Q80: A random sample of 11 third year
Q82: A readability analysis is conducted to determine
Q83: Two coffee-vending machines are studied to
Q84: A study was conducted to investigate the
Q85: The claim of a local real
Q86: A student is trying to decide if
Unlock this Answer For Free Now!
View this answer and more for free by performing one of the following actions

Scan the QR code to install the App and get 2 free unlocks

Unlock quizzes for free by uploading documents