A foreman wants to use an  chart to control the average length of the bolts manufactured.He has recently collected the six samples given below.
 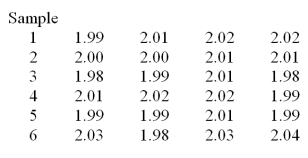 Determine the LCL and the UCL for the R chart.
A) (0 .0685)
B) (0 .076)
C) (0 .03)
D) (0 .0601)
Correct Answer:
Verified
Q43: Unusual sources of process variation that can
Q68: Assume that 25 samples of 50 each
Q80: If Q81: Among other quality measures,the quality of an Q82: A fastener company produces bolts with Q83: A fastener company produces bolts with Q85: A foreman wants to use an Q87: Use this information about 10 shipments of Q88: From 20 samples of size 100,total of Q89: Assume that 25 samples of 50 each![]()
Unlock this Answer For Free Now!
View this answer and more for free by performing one of the following actions

Scan the QR code to install the App and get 2 free unlocks

Unlock quizzes for free by uploading documents