Suppose that  and R charts are based on subgroups of size four are being used to monitor the tire diameter size of a new radial tire manufactured by a tire company.The
  and R charts are found to be in statistical control with
 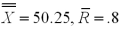 inches.A histogram of the tire diameter measurements indicates that distribution of these measurements is approximately normally distributed. Calculate the estimate of the percentage of tires that are out of specification.
A) 1.93%
B) 2.68%
C) 1.62%
D) 17.36%
Correct Answer:
Verified
Q93: A fastener company produces a certain
Q94: A foreman wants to use an
Q95: A fastener company produces bolts with
Q96: A foreman wants to use an
Q97: In 20 samples there are a total
Q99: Suppose that Q100: Among other quality measures,the quality of an Q101: The quality of an electronic component used Q102: A motorcycle manufacturer produces the parts for Q103: Suppose that ![]()
![]()
Unlock this Answer For Free Now!
View this answer and more for free by performing one of the following actions

Scan the QR code to install the App and get 2 free unlocks

Unlock quizzes for free by uploading documents