Consider the quarterly production data (in thousands of units)for the XYZ manufacturing company below.The normalized (adjusted)seasonal factors are .9982,.9263,1.139,.9365 for winter,spring,summer and fall respectively. 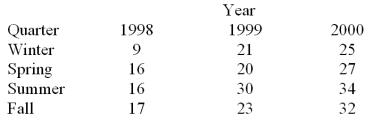 Based on the following deseasonalized observations (dt)given below,a trend line was estimated.The linear regression trend equation is: trt = 10.1 + 1.91 (t).Use the forecasting equation
  and calculate the forecasted demand for the fall quarter of 1998 and summer quarter of 2000.
Correct Answer:
Verified
Q132: Consider the quarterly production data (in thousands
Q133: Two forecasting models were used to predict
Q134: Two forecasting models were used to predict
Q135: The following data on prices and quantities
Q136: Based on the quarterly production data (in
Q138: Listed below are the price of a
Q139: Using the price of the following food
Q140: The following data on prices and quantities
Q141: The linear regression trend model was applied
Q142: Consider the regression equation ![]()
Unlock this Answer For Free Now!
View this answer and more for free by performing one of the following actions

Scan the QR code to install the App and get 2 free unlocks

Unlock quizzes for free by uploading documents