The following frequency table summarizes the ages of 60 shoppers at the local grocery store. 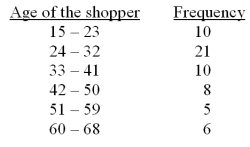 Calculate the approximate sample mean for this data (mean for the grouped data) .
A) 37.50 years
B) 36.25 years
C) 32.25 years
D) 40.25 years
E) 45.50 years
Correct Answer:
Verified
Q139: The following table shows the Price-to-Earnings ratio
Q140: The average life of Canadian women is
Q141: Researchers wish to study fuel consumption rates
Q142: The following frequency table summarizes the ages
Q143: Personnel managers usually want to know where
Q144: In a study of the factors that
Q145: In a study of the factors that
Q147: In a study of employee stock ownership
Q148: Researchers wish to study fuel consumption rates
Q149: Suppose that a company's annual sales were
Unlock this Answer For Free Now!
View this answer and more for free by performing one of the following actions

Scan the QR code to install the App and get 2 free unlocks

Unlock quizzes for free by uploading documents