Refer to the information provided in Figure 12.1 below to answer the questions that follow.
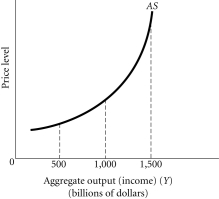 Figure 12.1
-Refer to Figure 12.1.At aggregate output levels below $500 billion,this economy is most likely experiencing
A) rapid increases in the growth rate of the money supply.
B) a boom.
C) excess demand.
D) excess capacity.
Correct Answer:
Verified
Q16: The graph that shows the relationship between
Q18: Refer to the information provided in Figure
Q22: Refer to the information provided in Figure
Q24: Refer to the information provided in Figure
Q25: Refer to the information provided in Figure
Q28: If there is an increase in the
Q32: An increase in aggregate demand when the
Q36: When the economy is producing at full
Q38: A movement down the aggregate supply curve
Q44: The rationale underlying policies to deregulate the
Unlock this Answer For Free Now!
View this answer and more for free by performing one of the following actions

Scan the QR code to install the App and get 2 free unlocks

Unlock quizzes for free by uploading documents