Use the following to answer question: 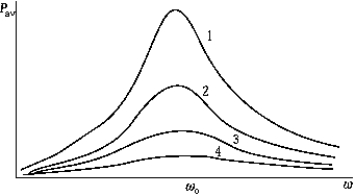
-The graph shows the average power delivered to an oscillating system as a function of the driving frequency.According to these data
A) the resonant frequency is greater than o.
B) the system corresponding to curve 1 has the smallest quality factor.
C) the system corresponding to curve 4 has the smallest quality factor.
D) the resonant frequency is less than o.
E) None of these is correct.
Correct Answer:
Verified
Q109: Use the following to answer question:
Q110: The energy of an oscillator decreases by
Q111: When driving over a washboard speed bumps,certain
Q112: The differential equation for a damped oscillator
Q113: Use the figure to the right to
Q115: Use the following to answer question:
Q116: Use the following to answer question:
Q117: A thin test tube is partially filled
Q118: The solution to the differential equation
Q119: Use the following to answer question:
Unlock this Answer For Free Now!
View this answer and more for free by performing one of the following actions

Scan the QR code to install the App and get 2 free unlocks

Unlock quizzes for free by uploading documents